Game Design
From Instinct to Insight — How Data Can Supercharge Your Game Design
Turning creative gut feeling into measurable, player-focused impact.
TL;DR
- Creativity is your compass, but data is your map.
- The best game designers use data to validate instincts, not replace them.
- Learn how to turn analytics into actionable insights that improve retention, monetization, and player satisfaction.
Introduction
Let’s be honest — most of us became game designers because we loved making things fun, not because we wanted to analyze dashboards.
But today’s game industry has changed.
Great art and clever mechanics are no longer enough.
In a world where player attention is the new currency, understanding why players stay or leave can make or break your game.
That’s where data-driven design comes in.
It doesn’t mean losing your creativity — it means making your creativity smarter.
Whether you’re building a casual match-3, a competitive shooter, or a mythological action game, data can guide your design instincts toward better player experience and better business results.
The Designer’s Dilemma: Art vs. Analytics
For many designers, “data” sounds intimidating — spreadsheets, retention graphs, DAU reports.
But here’s the truth:
Data doesn’t replace your gut. It refines it.
Think of your creative instinct as a painter’s brush.
Data simply sharpens your brushstroke — helping you see patterns invisible to the naked eye.
Every time you tweak an enemy’s health, adjust a reward timer, or change a tutorial step — you’re making a hypothesis.
Data just helps you test whether that hypothesis works for players in the real world.
What Is Data-Driven Game Design?
At its core, data-driven design means making creative decisions based on player behavior and measurable outcomes, not just intuition.
It’s about asking:
- “What are players actually doing?” (not what we think they’re doing)
- “Where do they stop playing?”
- “What keeps them coming back?”
Data helps you design around reality.
In other words — creativity sets the vision, but data ensures that vision works for thousands of players across devices, moods, and play styles.
The Key Metrics Every Designer Should Know
Here’s a simple, jargon-free list of metrics that every designer in India should understand, especially if you work in free-to-play (F2P) or mobile games.
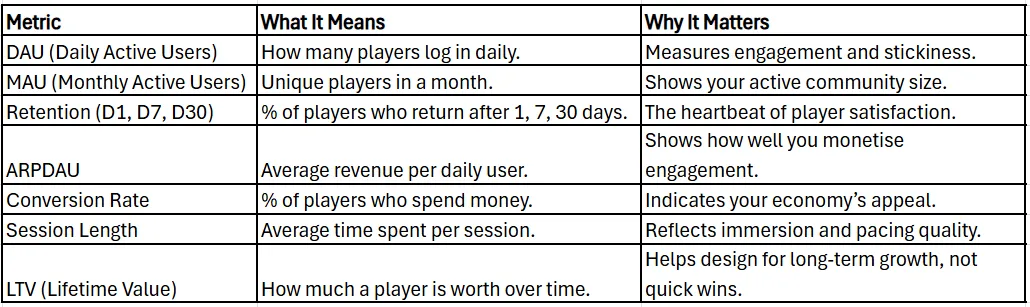
You don’t have to memorize all of these — just start by tracking Retention and Session Length. Those two alone reveal 70% of your game’s health.
The Design Loop: How Data Actually Shapes Creativity
Let’s break it down into a 4-step process you can apply to any game:
Step 1: Observe
Collect data using analytics tools (like Firebase, Unity Analytics, Data.ai).
Examples:
- Which level has the highest quit rate?
- Which reward triggers longer play sessions?
Step 2: Hypothesize
Use your design instincts to explain why this is happening.
“Maybe Level 7 is too long.”
“Maybe the reward animation is not satisfying enough.”
Step 3: Experiment
Create two variations (A/B testing):
- A = Current version
- B = Adjusted difficulty or pacing
Step 4: Measure & Iterate
Compare results over 7–14 days.
Whichever version performs better — that’s your validated design direction.
Real Example: Small Change, Big Impact
A hypercasual studio in Pune noticed players quitting around Level 4.
Analytics showed an average session length drop from 4 minutes to 2 minutes.
They looked closer: the jump timing was too strict.
They made a small tweak — increasing the “forgiveness window” by 0.2 seconds.
Result?
- Retention Day-1: +9%
- Session Length: +35%
- Ad Revenue: +12%
That’s the power of data-validated creativity.
Tools Every Game Designer Should Know
You don’t need to be a data scientist — just learn how to read and apply insights.

Turning Data into Design Decisions
Data itself doesn’t tell you what to do — it tells you where to look.
Here are some real patterns you can act on:
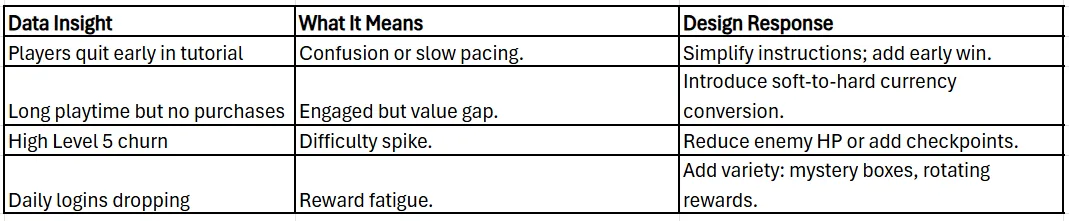
Always look for player intent behind the numbers.
If data is the “what”, design is the “why”.
Simple Formulas Every Designer Should Use
1. Retention Calculation
Retention (%) = (Returning Players / Total Players on Day 0) × 100
2. Session Average
Avg Session Time = Total Playtime / Total Sessions
3. Reward Fairness Ratio
Reward : Effort Ratio = Average Reward Earned / Average Time Spent
If this ratio is too low → frustration.
If it’s too high → inflation.
4. Upgrade Pacing
DaysToUpgrade = CoinsToUpgrade / (CoinsPerPlay × AvgPlaysPerDay)
This tells you how long it takes players to feel progress.
The Mindset Shift: From “I Think” to “I Know”
Before data:
“I think players are getting bored.”
After data:
“Players spend 30% less time on Level 6, and 45% quit after failing twice.”
See the difference?
Data gives your opinions credibility.
It turns gut feeling into evidence-based storytelling.
This mindset not only improves your design — it makes you more respected in team discussions, because your arguments are grounded in numbers.
How to Start as a Beginner
If you’re new to analytics, here’s a simple roadmap:
- Start Tracking: Add events in your prototype (Level Start, Level Complete, Shop Open).
- Observe Trends: Which screens players visit most?
- Ask “Why?”: Every number is a symptom — find the cause.
- Experiment: Run small design tests.
- Share Results: Use visuals (charts > words).
- Repeat: Every iteration builds experience.
You don’t need to be a data expert — you just need to care about your players’ behavior as much as your game’s art.
Conclusion
In modern game design, your gut tells you where to start, but data tells you where to go next.
It’s not art vs. analytics — it’s art powered by analytics.
By embracing data, Indian designers can move from being executors to strategic decision-makers — people who not only build fun experiences but also shape their studio’s success story. I’ll try to make a LiveOps bible soon.
So, the next time you open your design doc, remember:
Every click, every retry, every purchase — is feedback waiting to make your design smarter.
Use it. Learn from it. Grow with it.